Measuring AEO vs. GEO Visibility - One Dashboard, Better Decisions (Part 3 of 3)
AEO GEO Measurement
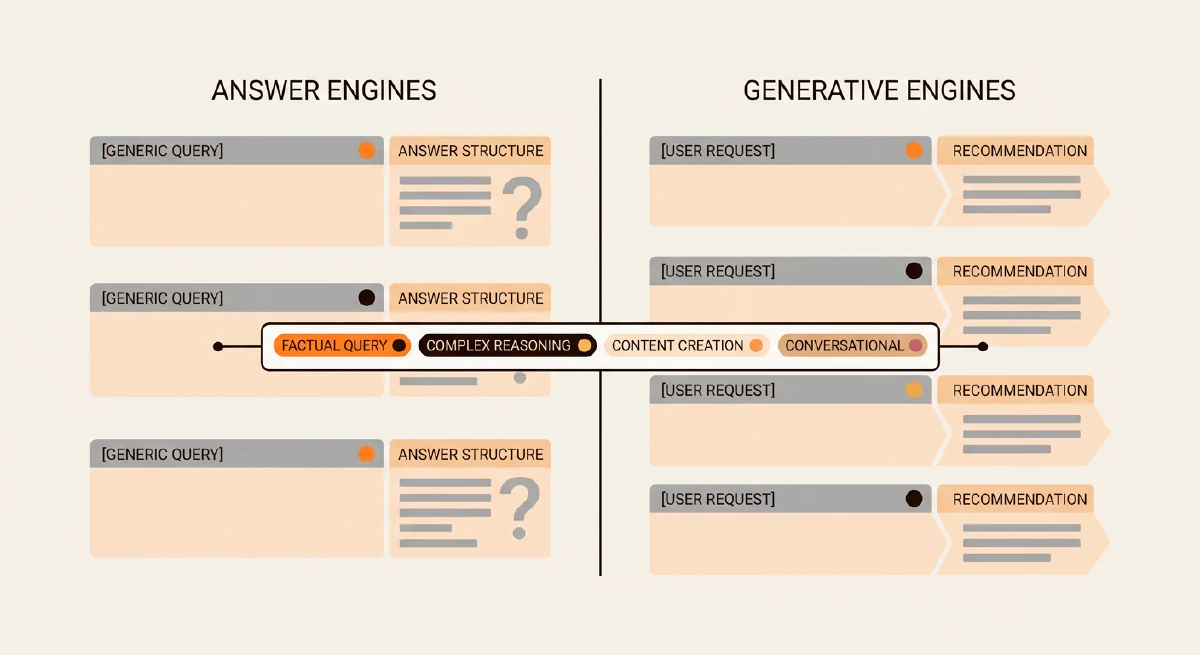

AI visibility measurement should not stop at “was the brand mentioned?” Zeover connects prompts, engines, cited sources, page quality, and content fixes so AEO and GEO work moves through one decision loop. See what needs fixing next.
Part 1 framed the terminology. Part 2 argued for source-worthy pages before optimization theater. Part 3 closes the loop on measurement.
A dashboard is useful only if it changes the next decision. If it reports a citation percentage but can’t show which page earned the mention, what the engine said, whether the answer was accurate, and what to fix next, it’s a scoreboard. Scoreboards feel good after a win and useless after a loss.
TL;DR
- AEO and GEO can share one dashboard because the core measurement event is the same: prompt, engine, answer, cited source, brand presence, and summary quality.
- Query-type tags are useful, but they should stay operational. Answer-shaped, comparison-shaped, recommendation-shaped, and brand-summary prompts tell the team which content shape to improve.
- Citation rate alone isn’t enough. A page can be cited and still misrepresent the brand, bury the useful source, or fail to move a buyer toward the next step.
- The best dashboard connects measurement to an editorial backlog. Every recurring gap should become a page fix, schema fix, source update, entity cleanup, or new content brief.
- AEO and GEO measurement belong together because buyers don’t separate the acronyms when they ask AI systems for help.
Measurement Starts With A Better Question
Most AI visibility dashboards answer the easiest question: whether the brand appeared.
That question matters, but it’s incomplete. The better question is what the engine used as evidence, and whether that evidence was good enough.
That shift changes the whole dashboard. The goal is no longer a bigger number in the citation-rate box. The goal is a clearer map of which pages earn trust, which pages are missing, which answers distort the brand, and which content investments are actually changing the surface.
Good measurement should make the next editorial meeting shorter. The team should be able to look at the dashboard and see the work: update this definition page, add sources to that product page, reconcile this brand claim, split this overloaded article, or retire this stale prompt.
The Measurement Event
One measurement event should capture the same facts across AEO and GEO:
- Prompt
- Engine
- Answer text or summary
- Brand presence
- Brand position when position applies
- Source URLs cited or used
- Page type
- Query type
- Accuracy status
- Recommended content action
That structure gives the team a durable record of what happened without turning the article into an internal playbook.
It also matches how current AI search products expose source behavior. OpenAI’s ChatGPT search announcement describes answers with links to web sources and a sources sidebar. Perplexity’s Search API documentation describes ranked web results with real-time data. Google’s AI features guidance keeps the focus on crawlable pages, useful content, and preview controls.
The engines differ, but the measurement primitive is stable: an answer was produced, sources were used or shown, and the brand either appeared accurately, appeared poorly, or didn’t appear at all.
Query-Type Tags Should Serve The Work
Tags are useful when they drive decisions. They become noise when they turn into internal taxonomy theater.
A simple model is enough:
Answer-shaped prompts ask for a definition, process, or direct explanation. These are AEO-heavy because the winning page usually needs a clear answer and close source support.
Comparison-shaped prompts ask an engine to weigh options. These are mixed. AEO can define the entities, but GEO has to carry proof, positioning, and category context.
Recommendation-shaped prompts ask what to choose. These are GEO-heavy because the answer depends on trust, evidence, third-party context, and use-case fit.
Brand-summary prompts ask what the brand is, does, or is known for. These expose entity consistency more than page-level optimization.
The tags should help the team understand why a page won or lost. They shouldn’t become public strategy notes, and they should not require two separate dashboards.
What The Dashboard Should Show
A useful dashboard should fit into one review conversation. It doesn’t need to show every number the system can calculate. It needs to show the numbers that change the plan.
Coverage: where the brand appears, where it’s absent, and which prompts repeatedly fail.
Citation quality: whether the cited page is the right page, whether the source is primary or incidental, and whether the engine appears to rely on the page for the actual claim.
Summary accuracy: whether the answer describes the brand correctly. A wrong answer with a citation isn’t a win.
Source diversity: whether visibility depends on one overworked page or a healthier set of source-worthy pages.
Content action: the next fix tied to the measurement event: rewrite, add sources, update schema, refresh a stale page, build a missing explainer, or clean up entity drift.
That final field is the difference between reporting and operating. A dashboard without a content action column usually becomes a monthly ritual instead of a management tool.
The Failure Modes A Single Score Hides
Citation rate alone can hide several problems.
The wrong page is winning. A blog post gets cited for a product question because the product page is thin or hard to parse. The dashboard should surface the mismatch, not celebrate the citation.
The answer is accurate but weak. The engine mentions the brand correctly but omits the proof that would make the answer persuasive. The fix may be a stronger source page, not another awareness article.
The brand appears in the wrong context. A comparison answer includes the brand but positions it around an old category, outdated audience, or stale feature. This is an entity-governance problem.
The page is source-worthy but invisible. The answer exists on the site, but it’s buried in a long article, missing schema, blocked from crawlers, or unsupported by internal links.
These are different problems. A single citation-rate number flattens them into one graph line.
The Review Cadence
The cadence should match the speed of decisions.
Monthly review works for the full benchmark. It gives enough time for content changes to be published, crawled, and reflected in answers.
Weekly review works for a smaller watchlist. The watchlist should include high-value prompts, major brand-summary prompts, and any query where a recent content fix should begin to show movement.
Quarterly review works for the prompt set itself. Retire stale prompts, add new category questions, check whether product positioning changed, and confirm that the tags still reflect how buyers ask.
The cadence isn’t about measuring more often for its own sake. It’s about checking often enough that the team can still act while the content decision is fresh.
Ownership Matters More Than Tool Count
The dashboard needs named owners.
The marketing lead owns the business question: which gaps matter enough to fund?
The content owner owns the prompt set and the backlog that comes out of measurement.
The editor owns whether a page is source-worthy, not only optimized.
The analyst owns consistency: prompt hygiene, engine coverage, source capture, and metric definitions.
Splitting AEO and GEO into separate reporting lines makes these handoffs worse. The work is already cross-functional. The measurement model should reduce friction, not add another vocabulary layer.
One Dashboard, Two Lenses
AEO and GEO should appear as lenses inside one dashboard.
The AEO lens asks whether answer-shaped prompts have clear, source-backed pages behind them. It cares about direct answers, FAQ-style structure where appropriate, source proximity, and whether the cited page can stand alone.
The GEO lens asks whether the brand appears accurately across broader discovery prompts. It cares about category authority, entity consistency, comparison context, source diversity, and whether answers reflect the current business.
Both lenses use the same underlying record. That’s the point. The team shouldn’t reconcile two exports to learn that the same page is cited in one tool and missing from another.
What Comes After The Dashboard
The dashboard should produce a backlog with four kinds of work.
Page fixes improve pages that already deserve to win but are hard to extract.
Source fixes add or update evidence where claims are unsupported, stale, or separated from their proof.
Entity fixes align names, categories, descriptions, and claims across public surfaces.
New content briefs fill genuine gaps where no public source-worthy answer exists.
This is where measurement becomes useful. It turns AI visibility from a vague anxiety into a set of editorial and technical tasks.
The Series Closer
This series separated AEO and GEO without turning them into rival departments. AEO is the answer-shaped slice. GEO is the wider discovery surface. The shared foundation is source-worthy content, clean entities, crawlable pages, honest schema, and measurement that leads to action.
The final recommendation is simple. Use one dashboard. Segment by query type and engine where it helps decisions. Tie every recurring gap to a content action. Then judge the program by whether the next version of the web gives AI systems better evidence to work with.


